End of Year Reporting Part 4: The Balance Sheet
Topic: WorkingPoint News | Comments Off on End of Year Reporting Part 4: The Balance Sheet
When it comes to end of year reports, don’t forget about the Balance sheet. Small Business Management and Accounting Guru Kelli Wall believes that the Balance Sheet can be your company’s most important decision-making tool.
The Balance Sheet report conforms to the standard accounting format by showing all of a company’s assets, all the liabilities, and the owner’s equity. Because the Balance Sheet uses a standard format, you can consistently compare your company’s financial position from one quarter to another, or compare your company’s Balance Sheet with another’s. With WorkingPoint, creating these reports is easy, which leaves you lots of time for things like present shopping and holiday parties!
Asset’s Section
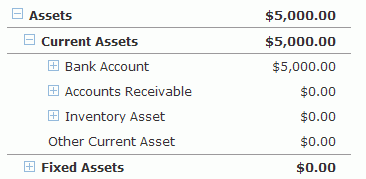
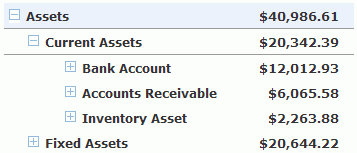
The Assets section is meant to show you the total worth of all your company’s property or assets. The total of all of your company’s assets appears at the top of the Assets section. In the Assets section of the report, all of your assets are listed in order of liquidity (which means how quickly that asset could be turned into cash, if need be). The assets that can be turned into cash the quickest are listed first, such as a bank or savings account. Fixed assets, such as a vehicle or equipment, appear farther down in the Assets section.

Current assets include assets that can be turned into cash within one year. These assets include your cash accounts, accounts receivable, inventory, and other current assets, such as pre-paid expenses. Pre-paid expenses are considered “current” because they represent goods or services you’ve already paid for, but not yet used.
Fixed assets include things like vehicles, equipment, office furniture, building improvements, and real estate.
Other assets include things like life insurance and royalties.
Liabilities & Equity Section
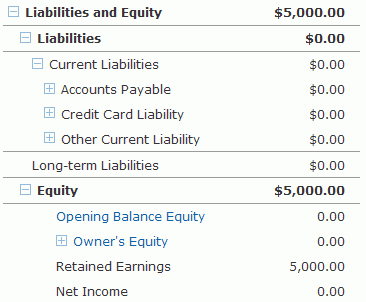
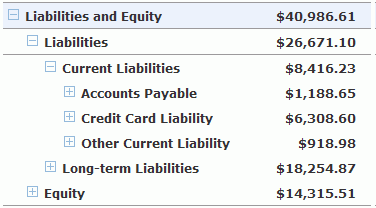
The Liabilities & Equity section is divided into Liabilities and then Equity. The Liabilities section is meant to show you the total of your company’s debts, both current and long-term. The total of all of your company’s liabilities appears at the top of the Liabilities section. In the Liabilities section of the report, all of your debts are listed in the order they must be repaid. The debts that are usually paid first appear at the top of the list, such as accounts payable, which usually must be paid within 30 days. Current liabilities are next and include debts that are typically paid within a year. Finally, Long-term liabilities are listed, such as loans and mortgages, which may be due in a year or more.

The Equity section shows you the investment you put into your company and retained earnings you have accumulated. The formula to calculate your equity is:
Total Assets – Total Liabilities = Your Equity
Reviewing for Year-end 2009
When reviewing your Balance Sheet for the end of the year, be sure that your account balances look right to you. That is, is your Accounts Receivable account reflecting only open invoices, is your Accounts Payable account only reflecting open bills, does your credit cad account balance include all 2009 purchases and payments? If you carry inventory, is the inventory value correct?
If your account balances look good, you are ready to print your reports or save them as PDFs for your records.
The next and final report I’ll walk you through is the Cash Flow report. This one can be tricky to read but is a great compliment to your Income Statement and Balance Sheet because it shows you how your used your cash this year.

